Query settings
CSA provides advanced tools for designating a candidate gene list, setting custom analysis parameters, and defining filters for genes and variants most likely to be associated with the identified phenotypes. Analysis parameters can be accessed from the Report settings tab in the Advanced report view or from the Advanced report settings tab on the Study Overview page.
Note
If the selected study is of the Clinical study type, only the Candidate genes subtab is displayed. All other analysis parameters are fixed.
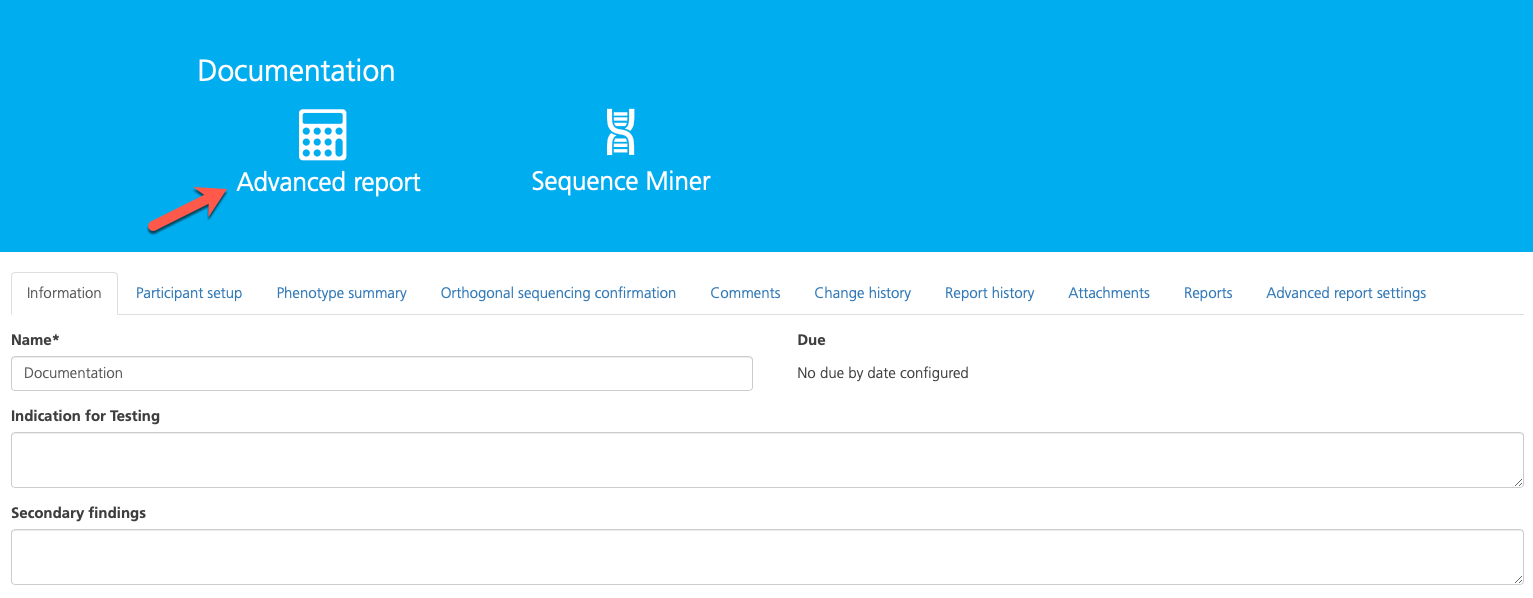
To configure report settings, open the Study Overview page and click the Advanced report link in the banner.
Open the Report settings tab. Advanced report settings are organized in vertical subtabs which can be expanded to view and edit. Default settings for each filter are shown in brackets ([]).
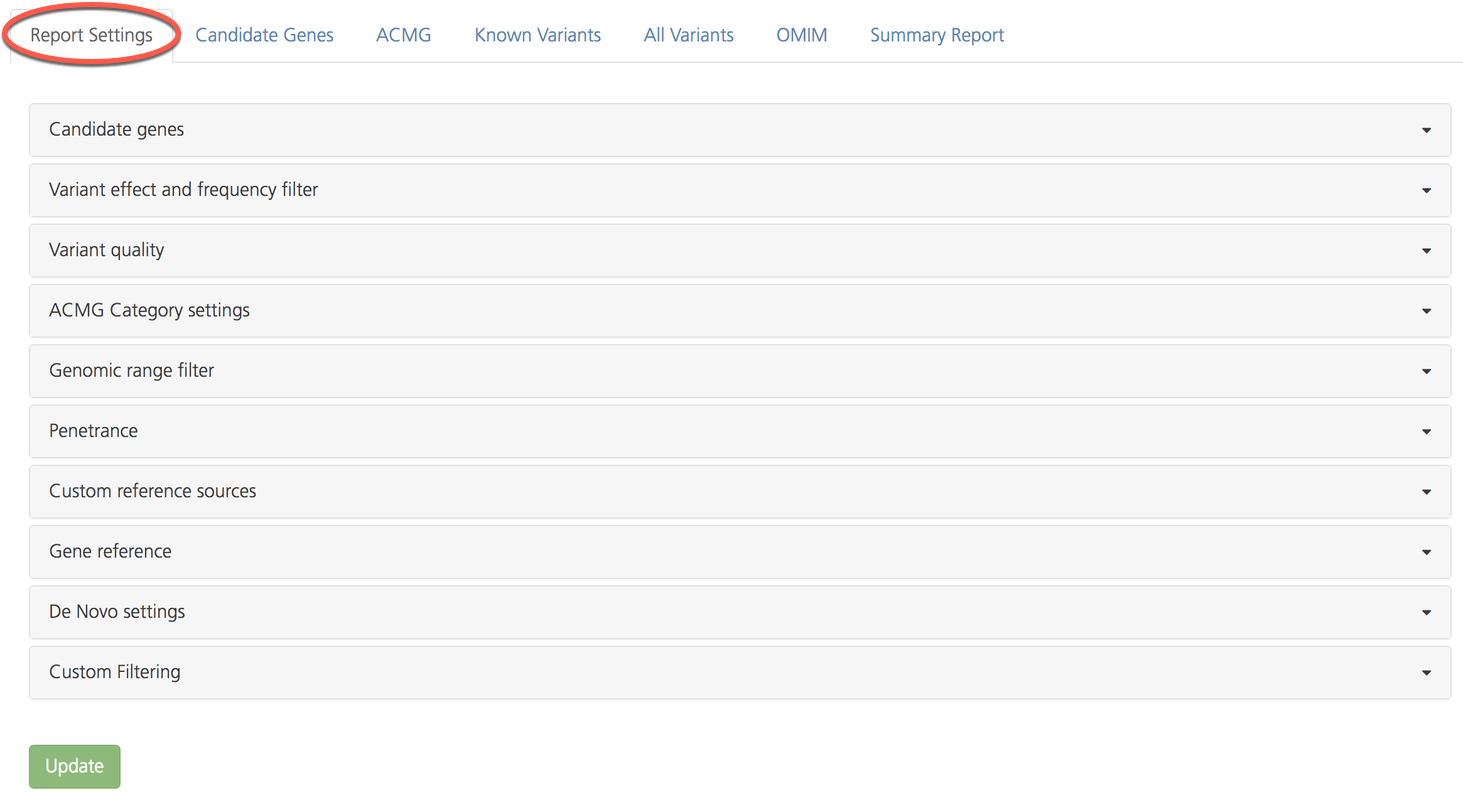
The following table provides a brief overview of report settings subtabs:
Subtab |
Description |
|---|---|
Filter variant analysis to include phenotype-associated gene sets, paralogs, defined gene lists, and/or custom gene lists |
|
Filter variants by population allele frequencies and biological consequence |
|
Filter variants by sequence read depth and quality scores |
|
Filter variants by clinical impact as designated by the American College of Medical Genetics and Genomics (ACMG) |
|
Filter exonic and repeat regions of the genome to include/exclude for variant analysis |
|
For studies with larger families, filter variants by the percent occurrence in the affected (‘case’) and unaffected individuals (‘controls’) groups |
|
Select custom filters for allele frequencies, genomic regions, and gene panels by importing user-specified reference lists for analysis |
|
Filter to include/exclude UTR regions of the transcript in variant analysis and select the reference transcript database |
|
Define filter settings for calling de novo variants |
|
Choose whether to enable custom filter settings, such as defining an expiration date for approved annotations |
Report settings are described in more detail below.
Candidate genes
The Candidate genes subtab is used to define a list of candidate genes for filtering the analysis. Candidate genes can be defined by entering phenotypes and clinical symptoms, as well as by entering individual genes or predefined genelists.
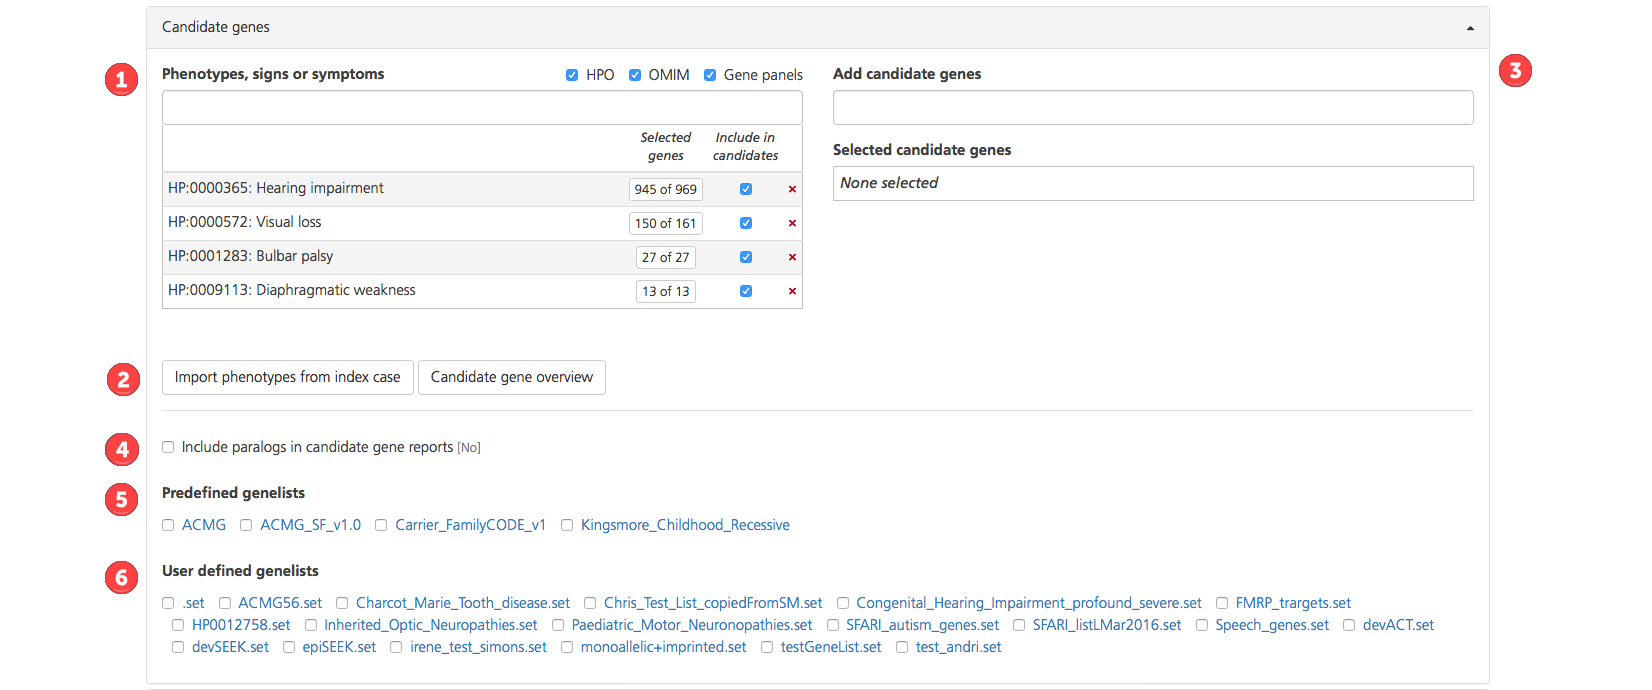
There are six options for creating a custom candidate gene list:
Enter terms in the Phenotypes, signs or symptoms box. If the term entered matches HPO or OMIM descriptions, a drop-down list appears with the HPO or OMIM codes for the matching descriptions (HPO codes are preceded by “HP:”, while OMIM codes are preceded by only the numeric OMIM ID). Additional gene lists may be selected from a compilation of commercial gene panels. The panels will indicate the panel ID and commercial source (e.g., Qiagen, GeneDx).
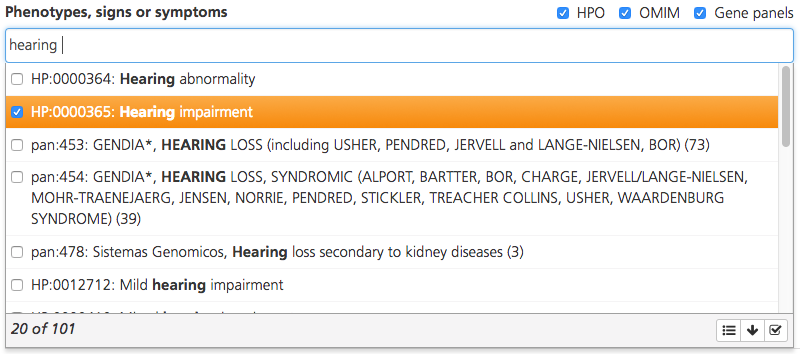
By default, the drop-down list displays the top 20 matching codes. To see more matching codes, click the arrow icon () at the bottom of the drop-down list. Hovering the cursor over a code in the list opens a tooltip with the full description.
Select one or more codes by selecting the checkboxes. To select all matching codes, click the Select all icon () at the bottom of the drop-down list. Selections may include many phenotypes for a single common term so be sure to carefully review the available terms before selecting all of them.
For multiple phenotypes, enter terms one by one and select the matching codes.
Once you’ve selected the desired codes, click the checkmark icon () to save your selections and add them to the phenotype list. Genes assigned to the selected phenotypic codes are added to the study’s candidate gene list.
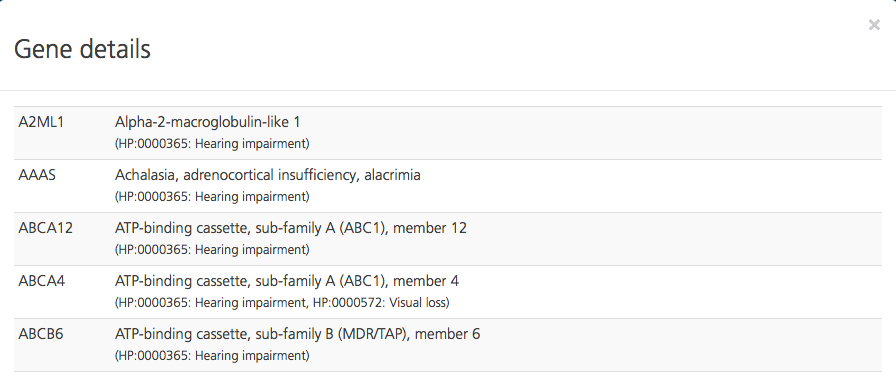
Click Import phenotypes the index case to import the HPO and OMIM codes associated with the phenotypes that were assigned to the index case from the Participant setup tab or while creating a study. Clicking Candidate gene overview opens a Gene details pop-up window, which shows the combined list of genes selected from the HPO, OMIM, and commercial gene panels.
In the Add candidate genes box, enter the gene symbol for candidate genes of interest (e.g., HBB), in addition to those from the Phenotypes, signs or symptoms box. This field is used to define candidate genes, including those associated with the phenotypes, signs, or symptoms of the affected individuals.

Enter full or partial gene names to open a drop-down list of matching genes. The text search uses the gene name, alias, and description. Hovering the cursor over a gene in the list opens a tooltip with the gene description.
Select one or more genes by selecting the checkboxes. To select all matching genes, click the Select all icon at the bottom of the drop-down list.
For multiple genes, enter the gene symbols one by one and select the matching genes.
Once you’ve selected the desired genes, click the checkmark icon to save your selections.
Genes selected in the Add candidate genes field (i.e., not derived from a phenotype entry) are displayed in the Selected candidate genes field. To see the gene symbol, gene name, and corresponding terms for the selected genes, click Candidate gene overview.
Select Include paralongs in candidate gene reports to analyze candidate genes and their paralogs (genes related by duplication in the genome). By default, paralogs are not included in the candidate analysis (i.e., the default value shown in brackets is “No”).
Select one or more Predefined genelists by selecting the checkboxes. Predefined genelists encompass standardized lists of verified genes linked to commonly diagnosed clinical conditions:
ACMG - This is the American College of Medical Genetics and Genomics (ACMG) recommended gene list for reporting of incidental findings in clinical exome and genome sequencing. It includes approximately 60 actionable genes affiliated with child- and adult-onset genetic disorders (the total number depends on the ACMG version associated with the study type). The complete recommendation is published in the 2013 publication ACMG recommendations for reporting of incidental findings in clinical exome and genome sequencing.
ACMG_SF_v2.0 - This is the updated ACMG recommended gene list for reporting of incidental findings in clinical exome and genome sequencing. The complete recommendation is published in the 2017 publication Recommendations for reporting of secondary findings in clinical exome and genome sequencing, 2016 update (ACMG SF v2.0): a policy statement of the American College of Medical Genetics and Genomics.
FamilyCODE - This is a gene panel of approximately 400 genes with implications for carrier screening.
Kingsmore_Childhood_Recessive - This is a 514-gene panel the publication Comprehensive Carrier Screening and Molecular Diagnostic Testing for Recessive Childhood Diseases by Stephen Kingsmore that describes childhood recessive disorders know to have an early onset. These genes harbor known pathogenic mutations that are causative in severe recessive diseases, and are recommended for preconception screening and diagnostic testing in potentially affected children.
Clicking on the name of the genelist opens a Gene details pop-up window, which shows the gene symbols and names inlcuded in the selected list. By default, no predefined genelists are selected.
Select a User-defined genelist. If a desired genelist is not available under Predefined genelists, generate and upload a custom genelist by clicking the Tools link in the Research Analysis section of the CSA dashboard. Custom genelists generated and verified in Tools can be selected as User-defined genelists. Custom genelists are specific to the selected project (see also Managing Genelists).
Variant effect and frequency filter
The Variant effect and frequency filter subtab provides filtering options for allele frequencies and VEP consequence impact, allowing thresholds for the following parameters:
The maximum population allele frequency of a variant when analyzing recessive, dominant, or compound heterozygous alleles
The maximum biological impact of a variant

Filters for allele frequencies are defined as follows:
No Allele frequency filtering (deselected by default) - Select this check-box to include all variants regardless of the reported population allele frequency. Pathogenic variants may have a lower allele frequency due to selection. If this filter is not selected, variants are filtered according to the other frequency filters.
Recessive max allele freq. (default value 0.03) - Click the arrow to open a drop-down list for selecting the maximum population allele frequency for a variant using a homozygous recessive inheritance model. The max allele frequency can be set to values ranging between 0.0005 and 0.1.
Dominant max allele freq. (default value 0.01): - Click the arrow to open a drop-down list for selecting the maximum population allele frequency for a variant using a dominant inheritance model. The max allele frequency can be set to values ranging between 0.0005 and 0.1.
Recessive max gt freq. (default value 0.0001): - Click the arrow to open a drop-drop list for selecting the maximum genotype frequency or the maximum frequency of the compound allele for a compound heterozygous inheritance model. The selected value is the maximum value of the allele frequency of two separate variants when multiplied together, and must be less than or equal to the maximum allele frequency squared. The max genotype frequency can be set to values ranging between 0.00000025 and 0.01.
The VEP maximum impact filter sets a threshold for the predicted degree of impact of a variant on the transcript. Variants can be limited by predicted impact, as described in VEP (Variant Effect Predictor) Settings, which provides a detailed description of the impact classes. Only “MODERATE” and “HIGH” impact variants are selected by default because these are considered the most likely pathogenic variants. Move the slider to the right or left to select “LOW” impact or to deselect “MODERATE” impact variants.
For more information about VEP settings, see Variant Effect Predictor (VEP) Settings.
Variant quality
The Variant quality subtab provides filters for determining the minimum variant quality calls to include in the analysis. Along with selecting high quality only or high and low quality calls, additional parameters derived from the Genome Analysis Toolkit (GATK) can be selected by clicking and dragging a slider.

Variant quality filters are derived from metrics determined for each variant called.
Use the Variant filter to select the overall quality of variants to include. Based on a confidence score (phred-scaled) of the likelihood that the call is correct at a site, the call is labeled as high confidence or low confidence. If the call is below the set confidence score threshold, the call is labeled “LowQual”. If the call is above the confidence threshold, the call is labeled “HighQual”.
Additional quality metrics for the genotypes called are as follows:
Min Gt Likelihood (default value 5) - Set the minimum in the difference of the genotype likelihoods (log 10/phred-scaled) from the most likely and second-most likely genotypes. Although this gives a rough estimate of the ratio of signal to noise, it is different from the posterior probability, which takes into account the allele frequency of the sequence variant. Use the slider to set the value to any integer value between 0 and 120.
Min Het Call Percent (default value 20%) - The minimum heterozygote call percent defines the fraction of reads that must be consistent with an alternative allele of a heterozygous genotype. For example, a value of “20” means that at least 20% and no more than 80% of the reads must be consistent with the sequence variant. Use the slider to set he value to any integer value between 1 and 100.
Min Hom Call Percent (default value 66%): The minimum homozygous call percent is the fraction of reads that must be consistent with alternative allele to be called as the homozygous genotype. For example, a value of “66” (the default value), means that at least 66% of the reads must be consistent with the sequence variant. Use the slider to set the value to any integer value between 1 and 100.
Min Read Depth (default value 8x): Set the minimum number of reads for a variant call. Variants observed in fewer reads are not considered for analysis. Use the slider to set the value to any integer value between 1 and 50.
ACMG Category settings
ACMG Category settings filters variants labeled as “Cat1 (Category 1) clinical impact”. Variants may be categorized as “Cat1” if they are known pathogenic or unknown but likely to be pathogenic. For detailed information on ACMG settings, refer to ACMG recommendations for reporting of incidental findings in clinical exome and genome sequencing.

Available filters include:
Cat1 clinical impact - “Pathogenic only” is selected by default, which means that only known pathogenic variants (as reported by ClinVar, HGMD, and/or OMIM) are included. To include variants that have unknown clinical significance in Cat1, select “Pathogenic and unknown”.
Cat1B distance - Include variants within a certain distance (between 0 and 6 bp) from a known pathogenic variant. For example, the default distance is “2”, which includes variants within 2 bp, based on the assumption that these variants lie in the same codon as a pathogenic variant (and will have a similar outcome in the protein product). Click inside the field to open a drop-down list and select the variants.
Allele frequency threshold for Cat4 (available in study types Mendel_V4 and above, as shown below) - Set a minimum allele frequency threshold for displaying Cat4 variants labeled as “pathogenic” in the Known Variants tab of the Advanced report. By default, the threshold is set to “0.03”. Additional values from 0.0005 to 1 can be selected from a drop-down list.

Allele frequency threshold for Cat4 filter, available in study types Mendel_V4 and above
Note
The Cat1B distance filter is not available in the Mendel_V6 study type because it includes additional Cat1 subcategories (1b, 1c, 1d) which incorporate previously unreported variants that occur at the same bp coordinate or in the same codon as a known pathogenic variant.
Genomic range filter
The Genomic range filter subtab provides filters for selecting exonic and repeat regions of the genome to include or exclude in the analysis.

Available filters include:
Max distance for exome overlap (default value 10 bp) - Only exonic variants are analyzed by default. To include additional regions near exons, select a value between 0 and 20 from the drop-down list to specify the number of bases beyond exon boundaries to include in analysis (the default value is 10 bp).
Exclude repeat regions (deselected by default) - Select this filter to exclude repeat regions from the analysis. If not selected, repeat regions are included in analysis.
Max distance for repeat overlap - If repeat regions are excluded, you can also exclude neighboring regions of the genome by selecting a value between 0 and 20 from the drop-down list. This value determines the distance in base pairs beyond repeat regions to exclude from the analysis (the default value is “2”).
Penetrance
The Penetrance filter determines the stringency settings for analyzing the penetrance of the genetic variant in a large family with multiple affected individuals.

By default, any variant that is present in controls is not considered causative for the disorder; only variants that are present in all cases are considered causative. This default setting can be adjusted using the following filters:
Case delta (default value 0) - The maximum number of participants assigned to cases (marked as “Affected”) who may be non-carriers for the disease variant (phenocopies)
Control delta (default value 0) - The maximum number of participants assigned to controls (marked as “Unaffected”) who are carriers of the disease variant and do not have the disease
Custom reference sources
Add custom filters such as custom allele frequencies, variant exclusion lists, and gene panels from the Custom reference sources sub tab.
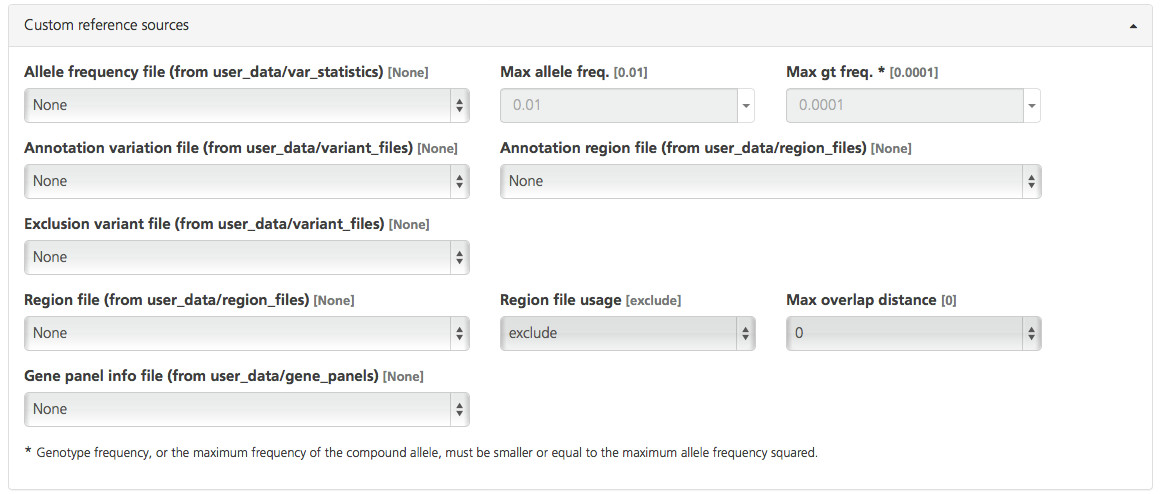
Custom files can be selected from the file location (in parentheses) designated for each filter option and pulled into a report. Custom files must be uploaded to the user_data folder in the Sequence Miner file directory to be available for selection as Custom reference sources (for required file formats, see Input File Formats in the Sequence Miner Manual).
The following table provides a brief description of Custom reference sources file options:
Custom reference source |
Sequence Miner location |
Description |
Required fields |
|---|---|---|---|
Allele frequency columns |
|
Variant allele frequencies |
Chromosome, Position, Reference, Call |
Annotation variation file |
|
Genetic variants to be included |
Chromosome, Position, Reference, Call, Your annotation header |
Exclusion variant file |
|
Genetic variants to be excluded |
Chromosome, Position, Reference, Call |
Region file |
|
Genomic region to include or exclude |
Chromosome, Start position, Stop position |
Gene panel info file |
|
Build a custom gene panel |
Chromosome, Gene start position, Gene stop position, Gene symbol |
Annotation region file |
|
Genomic region annotated for variants |
Chromosome, Start position, Stop position, Your annotation header |
Generating a custom file
To generate a custom file for upload, create a tab-delimited file that contains the required columns for the type of file you want to upload. All files require at least the chromosome and position columns.
Next, locate the user_data folder in the Sequence Miner File Explorer and create a new subfolder with the file name/path specified in the Sequence Miner location column. Once the file is uploaded to the appropriate subfolder in the user_data folder, it becomes available for selection in the Custom reference sources subtab.
Additional filtering fields include the following:
Max allele freq and Max gt freq
When using a custom allele frequency file, you can specify the maximum allele frequency for analysis using the Max allele freq. filter, and the maximum combined allele frequency using the Max gt freq. filter. The default settings retain only variants with allele frequencies below 0.01 or for compound heterozygosity models where the product of allele frequencies for two separate pathogenic variants is below 0.0001.
Region file usage and Max overlap distance
The Region file usage filter allows you to include or exclude variants according to a selected Region file. If a region file is selected, Max overlap distance determines the distance in base pairs beyond the user-specified regions for variants.
Gene reference
The Gene coverage filter in the Gene reference subtab allows you to select which portions of a gene will be included in the coverage analysis and define the exon boundaries that may be used to filter non-exonic variants.

Gene coverage can be calculated from the coding region and UTR (default) or limited to only the coding region (for WES data, select Coding only). The selection is reflected in the Gene coverage ideogram displayed next to the variant results in the Variant listing of the Advanced report. Because this setting has a filtering effect on the result set, the Coding setting may exclude some variants in non-coding regions.
In addition, the Gene coverage filter defines exon boundaries as follows:
Coding - def ##exons## = ##ref##/refgenes/refgenes_codingexons.gorz
Coding and UTR - def ##exons## = ##ref##/refgenes/refgenes_exons.gorz
Coding
Only coding exons are included (as defined by Ensembl/RefGene): gene coverage calculations consider only the coding exon regions; variants outside these coding exon boundaries may be excluded from variant listings (unless they have known pathogenic annotations or are protected from filtering).
Coding and UTR
All exons are included: gene coverage calculations consider both coding and non-coding exon regions; variants outside both coding and non-coding exon boundaries may be excluded from variant listings (unless they have known pathogenic annotations or are protected from filtering).
The selection is reflected in the Gene coverage ideogram displayed next to the variant results in the Variant listing of the Advanced report. Because this setting has a filtering effect on the result set, Coding contains fewer variants than Coding and UTR.
Note
In older versions of the Mendel study type (V6 and older), the Gene reference subtab also contains a VEP genes filter to select either “Ensembl (Ensembl VEP)” or “RefSeqGene (RefSeq)” as a gene reference. In newer versions of the study type, this option is preselected and fixed when creating a new study.
De Novo settings
The De Novo settings subtab allows you to select thresholds for calling de novo variants.

For a variant to be called de novo, it must be present in the proband (index case) and absent in both parents, and the position must be sequenced with good coverage and quality in the proband and in both parents.
The De Novo settings filters determine the maximum number of reads, with the call for the variant in question, present in each parent. By default, for a variant to be called de novo, it must be present in only 0 or 1 reads in each parent.
Custom filtering
In the Custom Filtering subtab, custom rules (set by a project administrator) can be toggled on or off.

Custom filtering rules can be used to determine how variant annotation approvals are handled, and are defined at the project level by a project administrator. Several types of custom rules are possible, including:
Setting an expiration date for approvals - For example, when a variant is annotated as “Pathogenic” and the annotation is approved, the approved annotation can be set to expire after a predefined amount of time. When it expires, the variant annotation will be labeled as “Due for reassessment” and will require another round of manual approval.
Hiding variants that are thought to be benign - For example, variants annotated as “Benign” can be hidden so that they do not appear in Advanced report listings.