Study Overview
Clicking on a study name on the Studies page opens the Study Overview, where details of an existing study can be reviewed and edited, and new studies can be created (see Creating a new study).
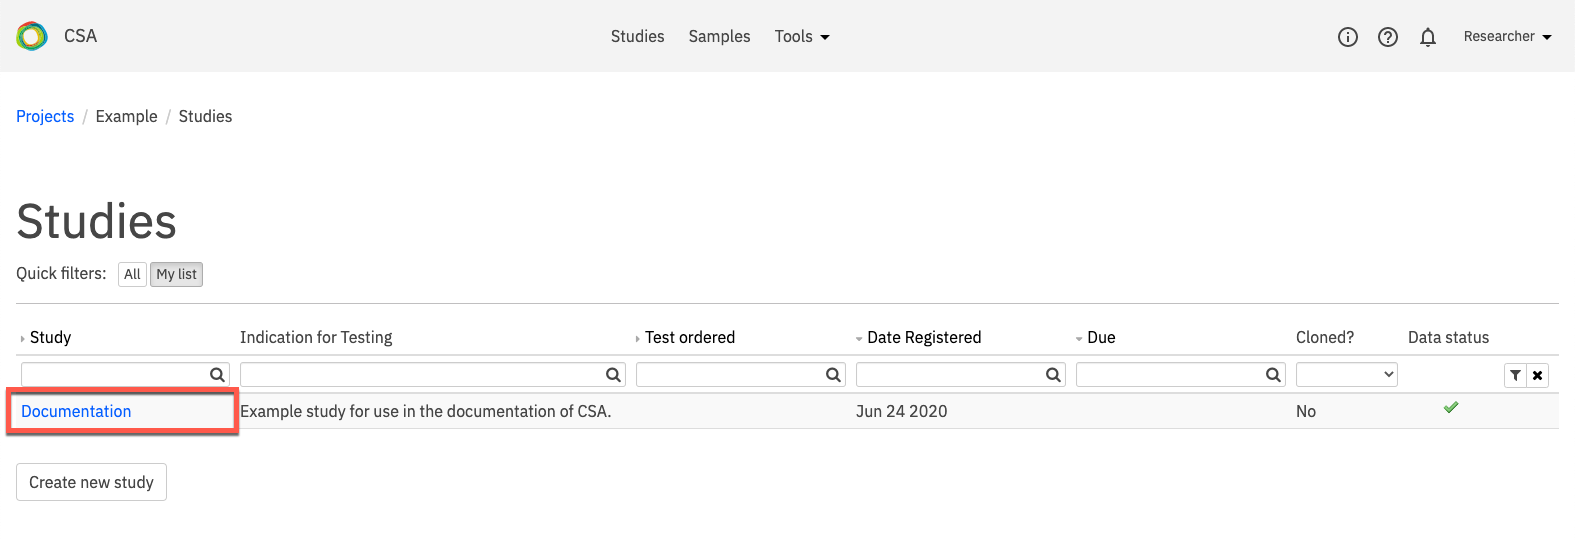
On the Study Overview page, the name of the selected study is shown in the blue banner at the top of the page. Depending on the study type, the banner may also contain Advanced report and Sequence Miner links.
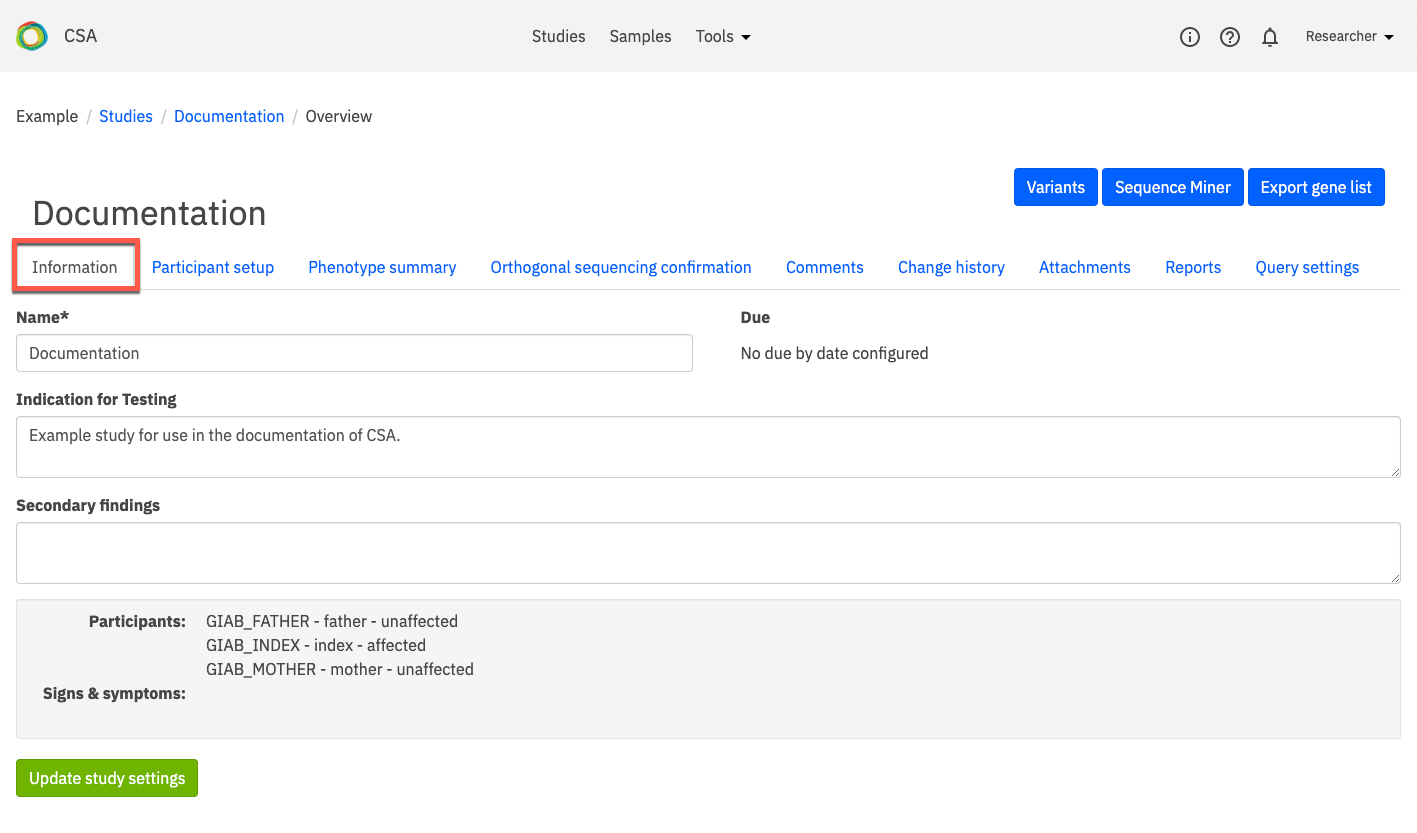
Study attributes and settings are displayed in a series of tabs. By default, the page opens to the Information tab. A brief description of each tab is provided in the table below:
Tab |
Description |
|---|---|
Describes the study and clinical features of the index |
|
Lists participants in the selected study and provides tools for editing or adding study participants |
|
Displays phenotypes assigned to study participants in the selected study |
|
List variants whose orthogonal sequencing status is set to “Requires confirmation” |
|
Provides a field to add comments or additional information |
|
Displays the change history of the selected study |
|
Displays a list of attachments pertaining to the study |
|
Provides tools for generating, reviewing, and editing a report summarizing the study’s findings |
|
Analysis settings for the queries that generate reports |
Note
Some tabs may not be visible depending on the study type of the selected study.
Open the tabs you want to view or edit by clicking on them. After editing study settings, you must click Update study settings to save your changes before navigating away from the tab (changes will not be saved otherwise). Study settings are described in more detail below.

Information
The Information tab contains information describing the study and clinical features of the index, as well as additional information provided when the study was created or last updated.
There are three editable free-text fields:
Name - This field holds a descriptive name for the selected study, preferably one that includes a reference to the phenotype, the family identifier, and the date. To edit this field, enter only letters, numbers, dashes, and/or underscores.
Indication for testing - This field is used to describe the clinical features of the case and/or participants and provide information that may be used as a reference, for example, phenotypic descriptions. Text entered here is carried throughout the study and populates the Viewing Query Settings and Reports tabs, but is not used by the system for sample analysis.
Secondary findings
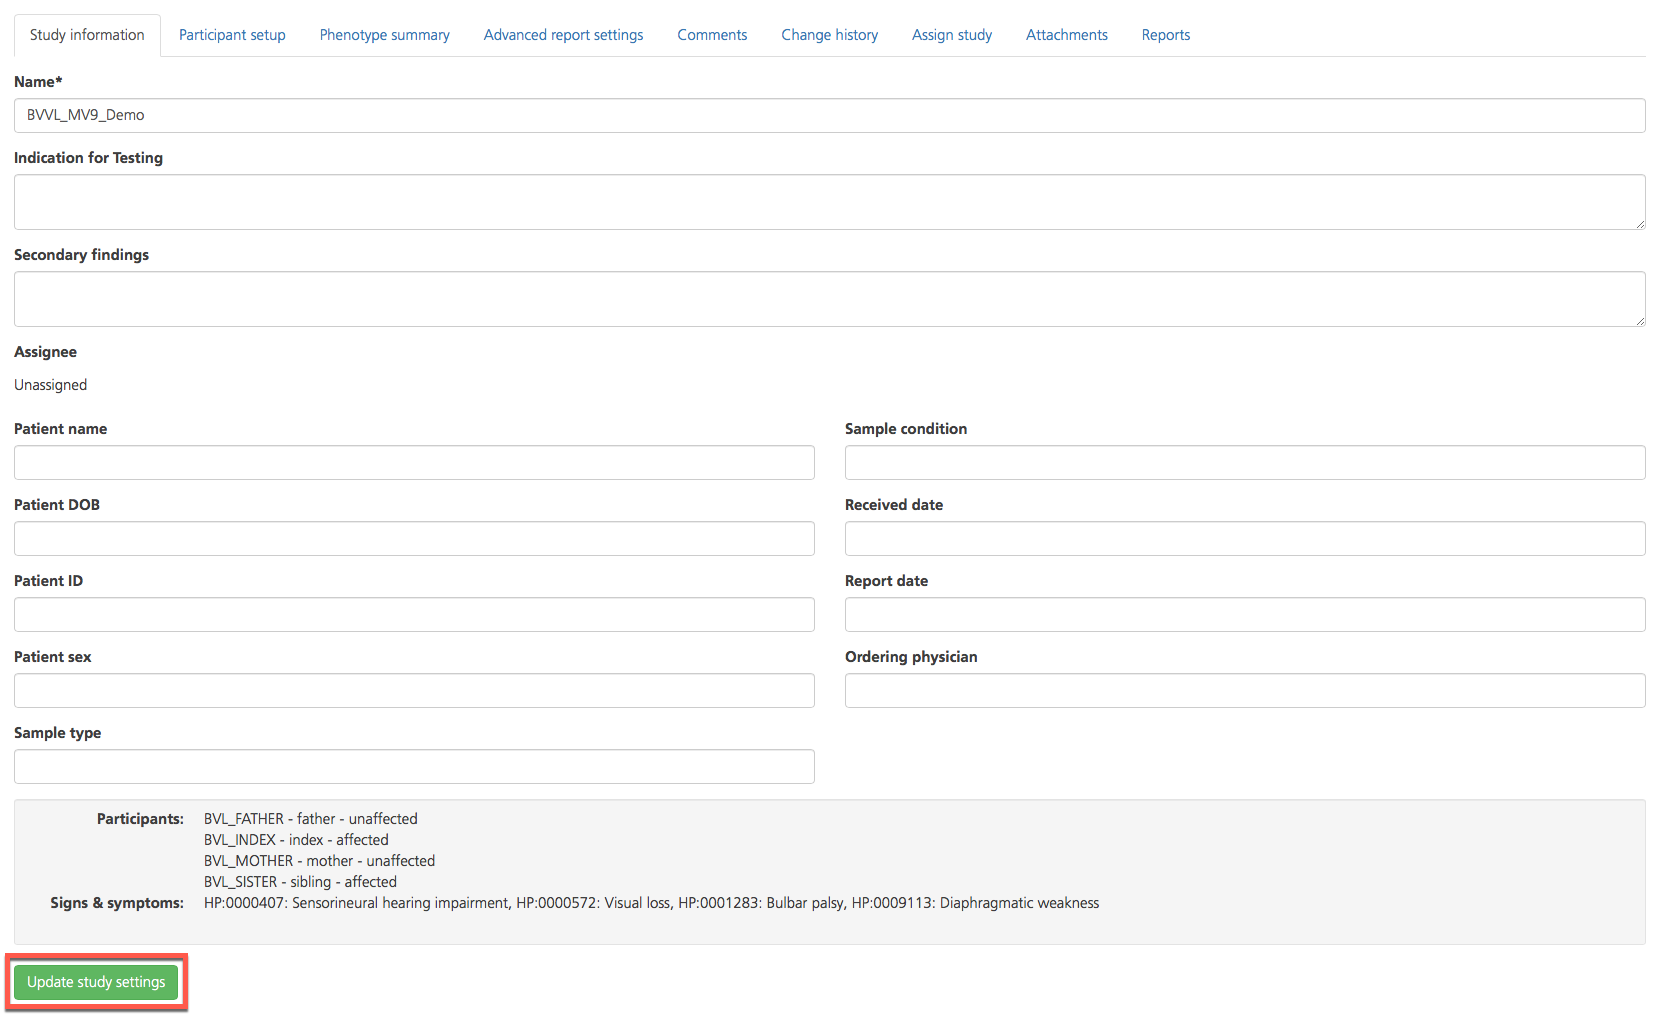
In the grey panel at the bottom of the page, the following information is displayed:
Participants - The individual samples selected for the study analysis (see also Creating a new study and Participant setup)
Signs & symptoms - The phenotypes entered for the study with the corresponding HPO code, OMIM code, and/or gene panel ID; if no information is provided, “N/A” is displayed (see also Candidate genes in reportSettings)

Participant setup
The Participant setup tab lists all participants in the selected study and provides tools for editing or adding study participants. Participants selected for analysis in the study are listed in rows, and the attributes of each participant are displayed in columns which contain editable information.
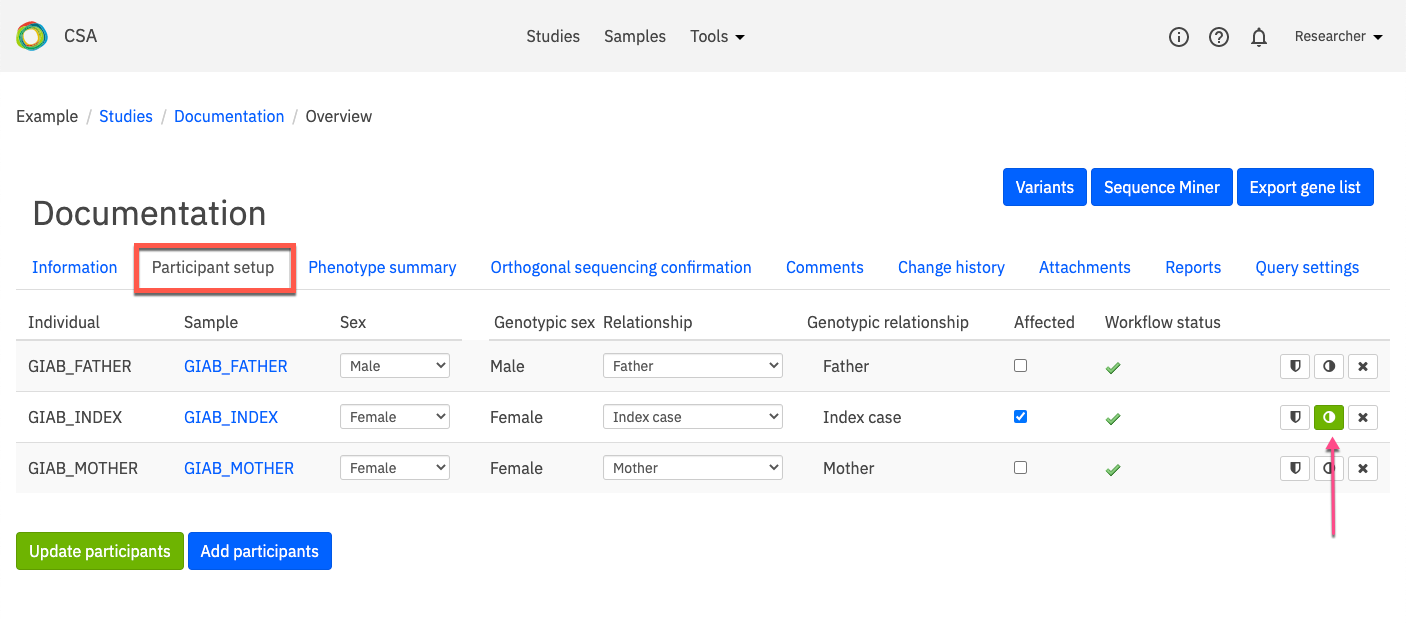
Participant attributes include the following:
Column |
Description |
|---|---|
Individual |
The individual ID for participants in the study |
Sample |
The sample ID assigned to the participants’ samples in a study |
Sex |
The biological sex that was selected at the time the data was uploaded or the study created; to edit this field, click the arrow to open the drop-down menu and select select the biological sex of the participant |
Genotypic sex |
The sex indicated by the genotype of the sample. |
Relationship |
Indicates whether the participant is the proband (index case) or a first degree relative (e.g., father, mother, sibling, twin) of the index case for a family study. Additionally, the participant may be assigned as a case or control sample for large cohort studies. Each study requires one and only one index case participant. To edit the relation of the participant, click the arrow to open the drop-down menu and select a new relation to the proband. |
Affected |
Indicates whether the participant exhibits the clinical phenotypes associated with the disorder being analyzed. To edit a participant’s affected status, select the check-box. A blue checkmark indicates the individual is affected. |
Workflow status |
The status of the participant’s data sample uploaded into the system for analysis; only samples with a green checkmark are displayed in the Participant setup tab and can be added to studies |
Adding participants to a study
To add participants to a study, click Add participants.

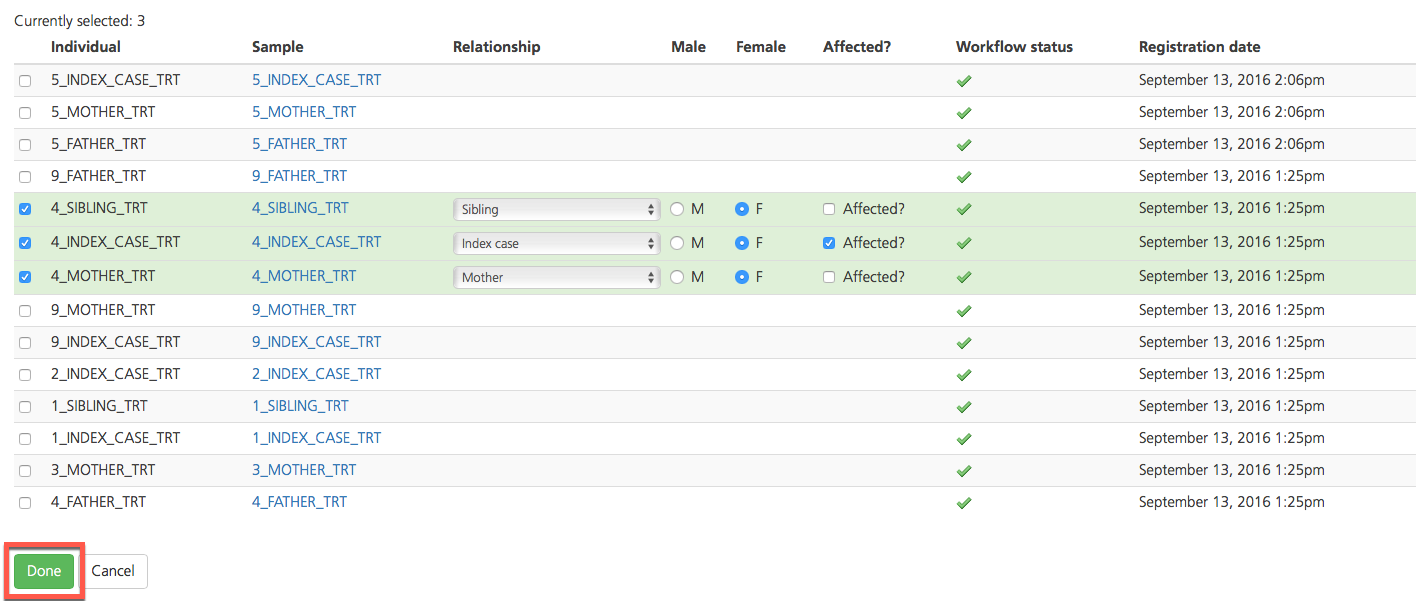
On the Add participants to study page, select at least one participant for inclusion in the study from the list of individuals whose samples have been uploaded to the Genuity Science system. Alternatively, participants can be added when creating a new study.
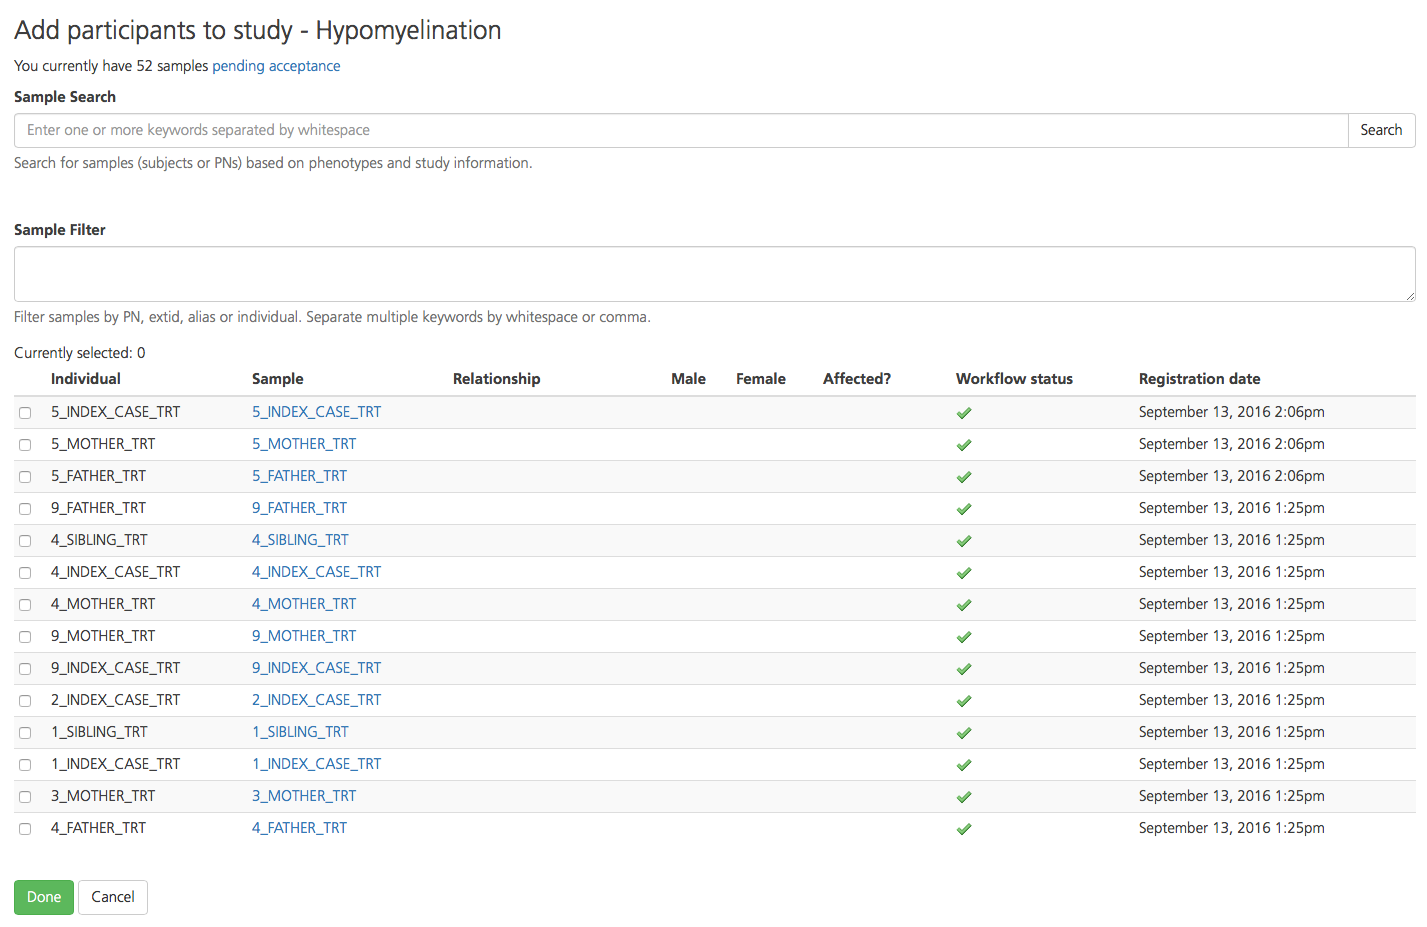
To find participants, type a keyword such as a phenotype term, attribute, or PN into the Sample Search box.

To find participants based on a PN-specific term, enter the term in the Sample Filter box.

Select participants by selecting the checkboxes in the leftmost column, next to the Individual ID. Selected rows are initially highlighted in yellow.
Each study must include a single index case. In the Relationship column, designate one index case. For all other participants, designate the relationship to the index case. When the Relationship field is designated for a participant, the row is highlighted in green.

In the Affected column, designate the affected/unaffected status of the index case and all other participants.
The Male and Female columns are automatically designated for each participant depending on how the sample was categorized at the time of upload.
In the Workflow status column, a green checkmark indicates that the data for the selected sample is ready for analysis. If the green checkmark is NOT displayed for the sample, variant analysis that includes this sample will fail.
The Registration date column shows the date the sample was registered in the project.
Note
Failure to designate a index case in the Relationship column will result in an error message.
Save added participants by clicking Done to return to the Participant setup tab.
Click Update participants to update the study participants and return to the Study information tab.

On the Study information tab, click Update study settings to save all changes and update the study.
Adding phenotypes to participants
To open the Registered phenotypes page for a selected participant and add phenotypes, click the Phenotypes (half-moon) icon on the right-hand side of the selected row. Phenotypes added in the Participant setup tab will be made available in the Advanced report settings tab of Study Overview and will enable phenotype querying across samples in the project. Alternatively, phenotypes can be added when creating a new study.
This field uses the clinical descriptions of a case to suggest candidate genes for analysis. This can be used to create a candidate gene list and/or define patient cohorts across the project based on phenotypes.

On the Registered phenotypes page, enter the phenotypes in the Phenotypes, signs or symptoms box. Full or partial terms entered are mapped to the phenotype and disease databases Human Phenotype Ontology (HPO) and Online Mendelian Inheritance in Man (OMIM) and/or commercial gene panels.
If the term entered matches HPO or OMIM descriptions, a drop-down list appears with the HPO or OMIM codes for the matching descriptions (HPO codes are preceded by “HP:”, while OMIM codes are preceded by only the numeric OMIM ID). Additional gene lists may be selected from a compilation of commercial gene panels. The panels will indicate the panel ID and commercial source (e.g., Qiagen, GeneDx).
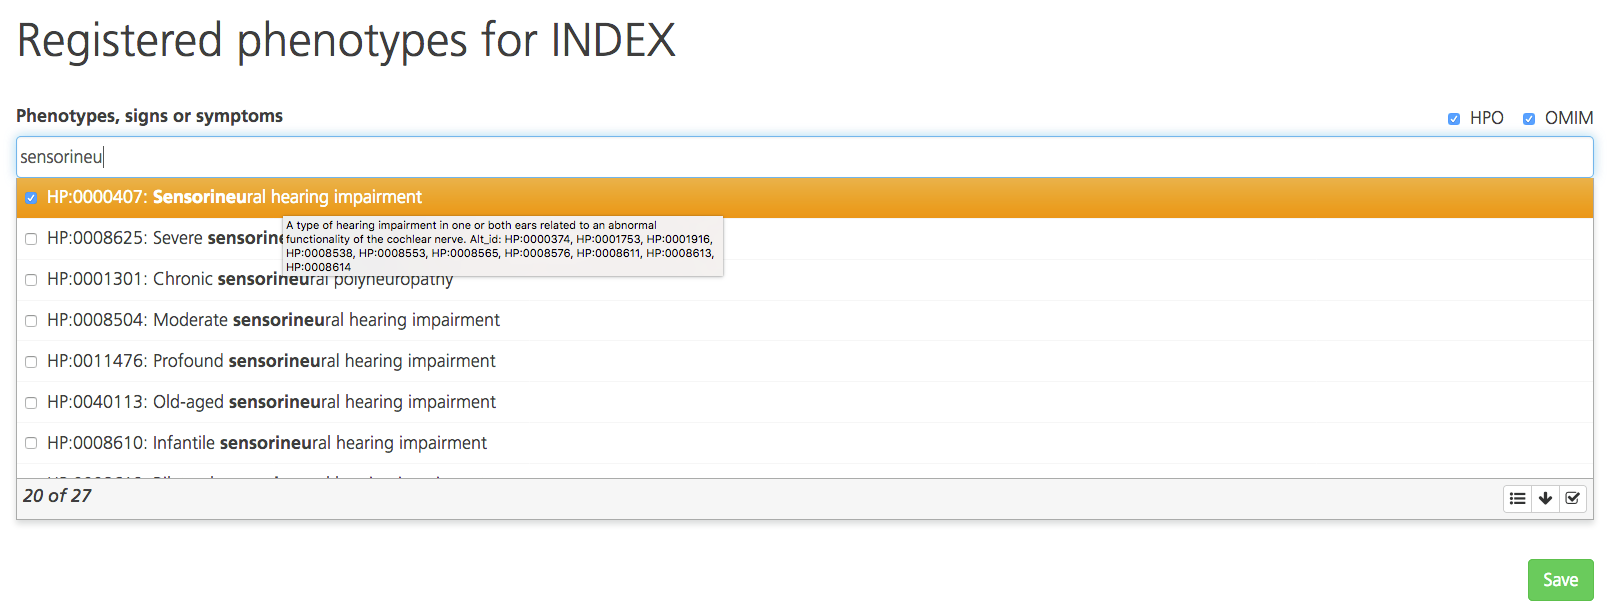
By default, the drop-down list displays the top 20 matching codes. To see more matching codes, click the arrow icon at the bottom of the drop-down list. Hovering the cursor over a code in the list opens a tooltip with the full description.
Select one or more codes by selecting the checkboxes. To select all matching codes, click the Select all icon at the bottom of the drop-down list. Selections may include many phenotypes for a single common term so be sure to carefully review the available terms before selecting all of them.
For multiple phenotypes, enter terms one by one and select the matching codes.
To save the phenotypes, click Save. To remove a phenotype from the list, click the red x icon.

Return to the Study Overview by clicking the study name in the navigation bar.

Open the Participant setup tab and click Update participants to save the changes and return to the Study information tab. When phenotypes have been added to a participant, the Phenotypes (half-moon) icon on the right-hand side of the selected row turns green.

On the Study information tab, click Update study settings to save all changes and update the study.

Editing study participants
To edit information such as Sex, Relationship or Affected status, edit the columns in the selected row (note that some columns cannot be edited).
Click Update participants to save the changes and return to the Study information tab.

On the Study information tab, click Update study settings to save all changes and update the study.

Viewing additional attributes
For each participant listed in the Participant setup tab, additional attributes can be viewed in a new window by selecting one of the icons in the column on the far right-hand side of the selected row.

Opening the Sample view
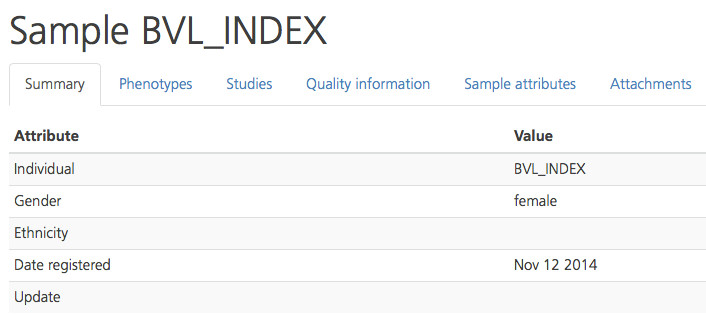
Clicking on the Sample ID in a selected row opens the Sample page, which contains six tabs that provide information about the selected sample.

The Summary tab, displays the Individual ID, Sex, Ethnicity, Date registered, and Update information assigned to the selected sample.
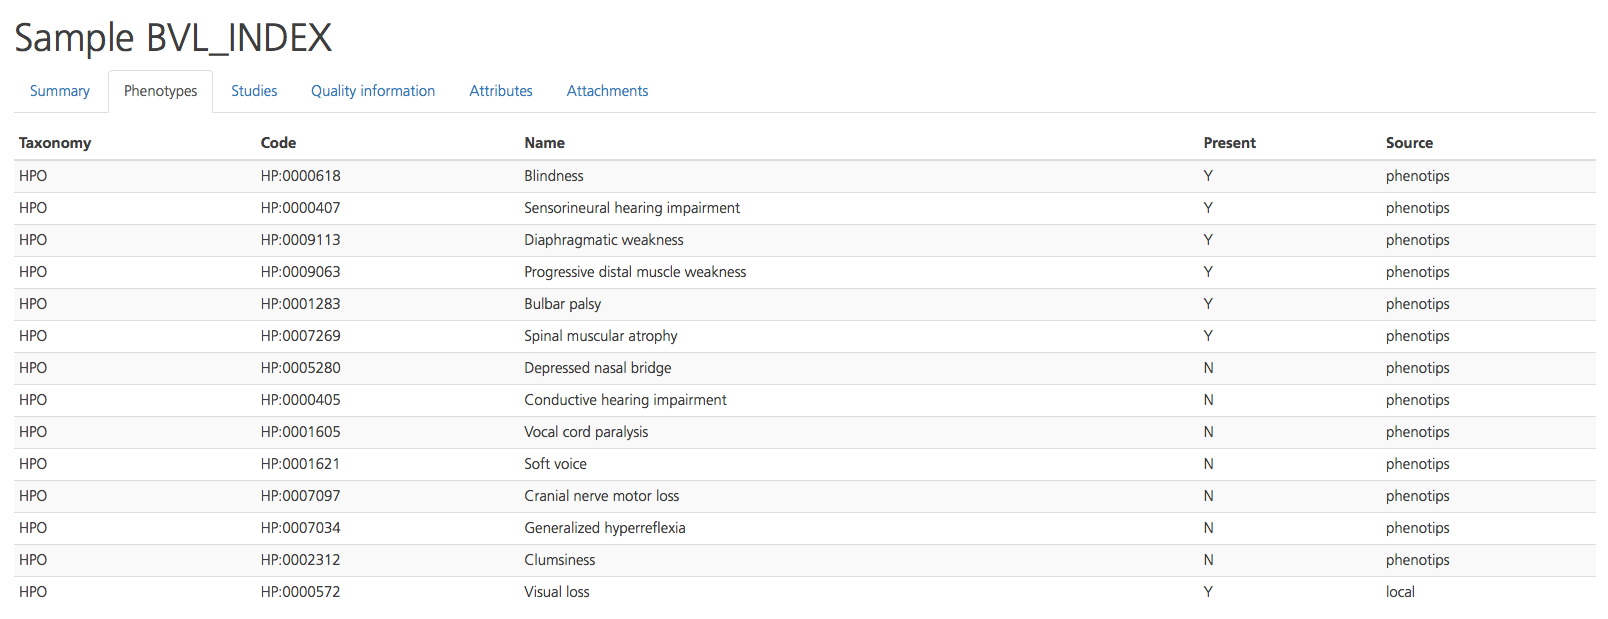
The Phenotypes tab displays the clinical symptoms entered for the selected participant through the Phenotips tool, including the Taxonomy (HPO or OMIM), Code, and Name of the class description. The Present column displays a “Y” or “N” (Yes or No) to indicate whether the selected participant exhibits the symptom.
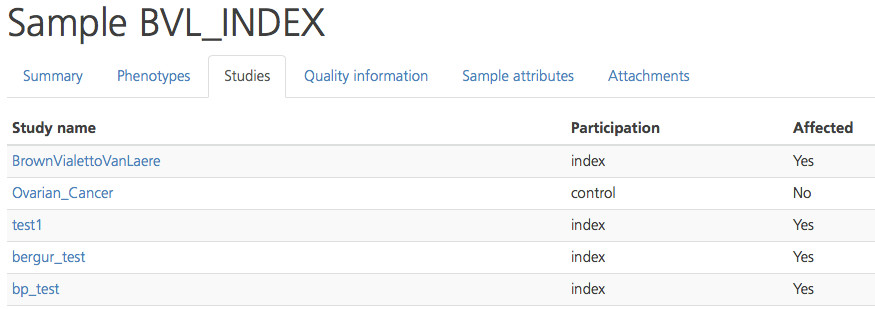
The Studies tab lists any additional studies to which the selected participant has been assigned, including the Study name, Participation role of the participant in the selected study, and whether the participant is an Affected individual in that study. Clicking on a Study name in the list opens the Study Overview page for the selected study.
The Quality information tab provides measurements and statistics to determine the quality of the sample data for the selected participant. Metrics are described for Variants, QC Ratios, Exome, and Genes. Quality scores are calculated for the indicated Analysis and Attribute.
Note
For studies created with the Mendel V6 study type, these QC metrics are available from this tab only. The Clinical Report tool differs from earlier study type versions and is not generated through a Summary Report tab.
Quality measures are compared to those of other samples in the same project and are reported in the In Distribution column as “Norm” if they are within two standard deviations of the mean. “Low” indicates below two standard deviations of the mean, and “High” indicates above two standard deviations of the mean.
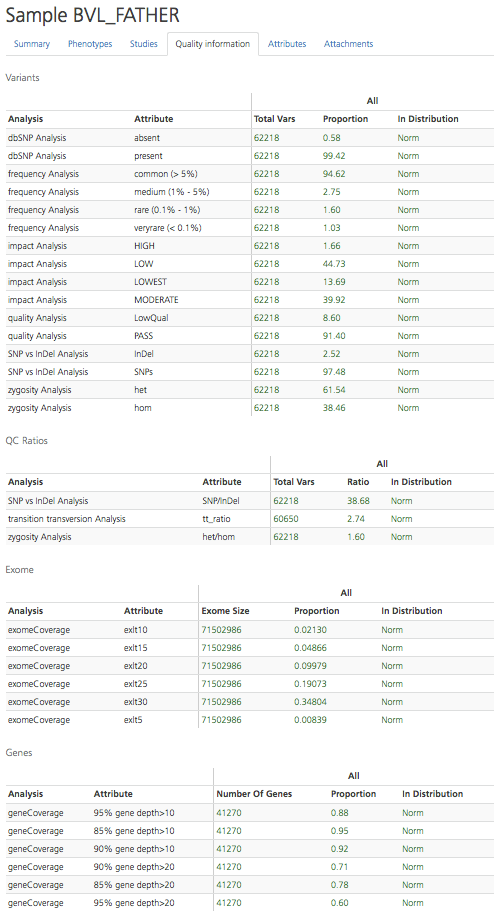
The Quality information tab can also be accessed by clicking the Quality icon in the selected row of the Participant setup tab.

The Sample attributes tab contains sample attributes included during the sample upload. It also typically includes information about the sample processing during upload to the system.
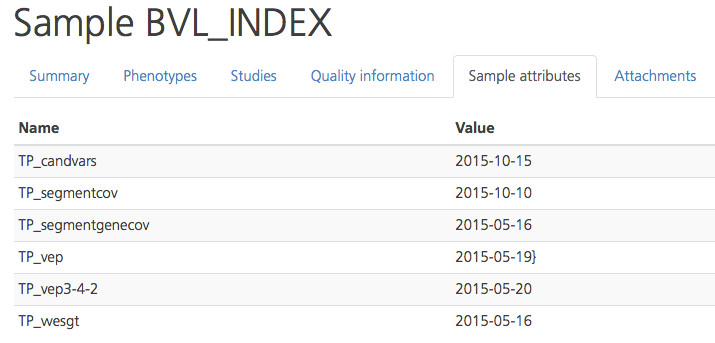
The Sample attributes tab can also be accessed by clicking the tag icon in the selected row of the Participant setup tab.

The Attachments tab provides access to additional documents associated with the sample.

Viewing and editing phenotypes
Clicking the Phenotype (half-moon) icon in the selected row of the Participant setup tab opens the Registered phenotypes page where you can view registered phenotypes for the selected participant or add phenotypes. When phenotype information has been entered, the half-moon icon turns green.

Removing participants from a study
To remove participants from a study, click the Remove participant (x) icon on the far right-hand side of the selected row.
Click Update participants to save the changes and return to the Study information tab.

On the Study information tab, click Update study settings to save all changes and update the study.

Note
Remember to save all changes before moving to another page or tab. If you switch to a different tab or leave the page without saving, your changes will be lost.
Phenotype summary
Phenotypes assigned to participants in the selected study can be viewed on the Phenotype summary tab. Information about the phenotypes for each participant is organized in the following columns:
Column |
Description |
|---|---|
Taxonomy |
The database origin of the phenotypic code (e.g. HPO, OMIM, etc.) |
Code |
The ID number assigned to the phenotype in the designated taxonomy |
Name |
The description or label for the phenotype of the taxonomy code |
In index |
Displays “Y” (Yes) if the phenotype is observed in the assigned index case; displays “N” (No) if the phenotype is not observed in the index case |
In cases |
The number of participants in the selected study designated as “Affected” and assigned to cases (does NOT include the index case); This information can help identify which individuals share related phenotypes and whether they are also “Affected” |
In controls |
The number of participants in the selected study designated as “Unaffected” and assigned to controls; this information can help identify which individuals share related phenotypes and whether they are also “Unaffected” |
Columns in the Phenotype summary cannot be edited. Phenotypes are assigned to participants when Creating a new study or from the Participant setup tab.

Orthogonal sequencing confirmation
The Orthogonal sequencing confirmation tab lists variants that have orthogonal sequencing set to “Requires confirmation” and may require attention. Orthogonal sequencing is an annotation field that can be specified for any variant from the when annotating variants in the Advanced report view. Of the available fields in the Variant Summary, only variants set to “Requires confirmation” are displayed on this tab.

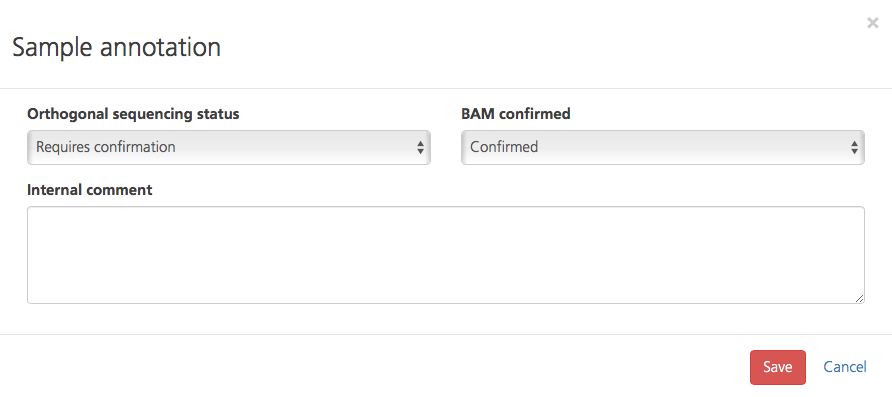
To edit the annotation, click the Comment icon to open the Sample annotation pop-up window.

In the Orthogonal sequencing status field, select from the following available values: Requires confirmation, Confirmed, Not real, or No confirmation required.
In the BAM confirmed field, select from the following available values: To be confirmed, Confirmed, or Not real.
Enter an Internal comment for your reference and click Save to save your changes.
To export a complete list of variants that require Sanger confirmation, click Orthogonal sequencing export list at the bottom of the page.
Annotated variants
The Annotated variants tab appears if variants have been annotated in the selected study. Variants appear in this tab if they have been annotated or starred. Annotations can include any comment made on the variant or any edits made to fields in the Variant Summary or Variant Curation window.
To sort the columns, click on the column header (or Mode of inheritance column header). To search for annotated variants, enter search terms into the Search bar at the top right-hand side.

Comments
The Comments tab provides a field to add additional descriptive information about the selected study. Enter comments in the text box and click Add comment to save.

Change history
The Change history tab displays a record of the changes made to the selected study.

The change history in listed in chronological order with the most recent version at the top of list, and includes the following columns:
Column |
Description |
|---|---|
Assigned to |
The user assigned to the study |
Case status |
The status of the case |
Changed by |
The user that made the change |
Date of change |
The date the change was made to the study |
Comment |
Report history
The Report history tab displays the report version history for the selected study.

The report history in listed in chronological order with the most recent version at the top of list, and includes the following columns:
Column |
Description |
|---|---|
Generated by |
The name and email address of the user who generated the report |
Date generated |
The date the report was generated |
State |
Indicates whether the report is ready for download |
To download a PDF of the report, click the icon on the far right-hand side of the selected row.

Attachments
The Attachments tab displays a list of files associated with the study.

Details about attached files are displayed in the following columns:
Column |
Description |
|---|---|
Sample |
The Sample ID associated with the attached file |
File name |
The name of the attached file |
File created at |
The date the file was created |
File updated at |
The date the file was last updated |
Reports
From the Reports tab you can generate a report to summarize the findings and conclusions of the selected study analysis. Generated reports can also be opened, edited, and reviewed for approval from this tab.
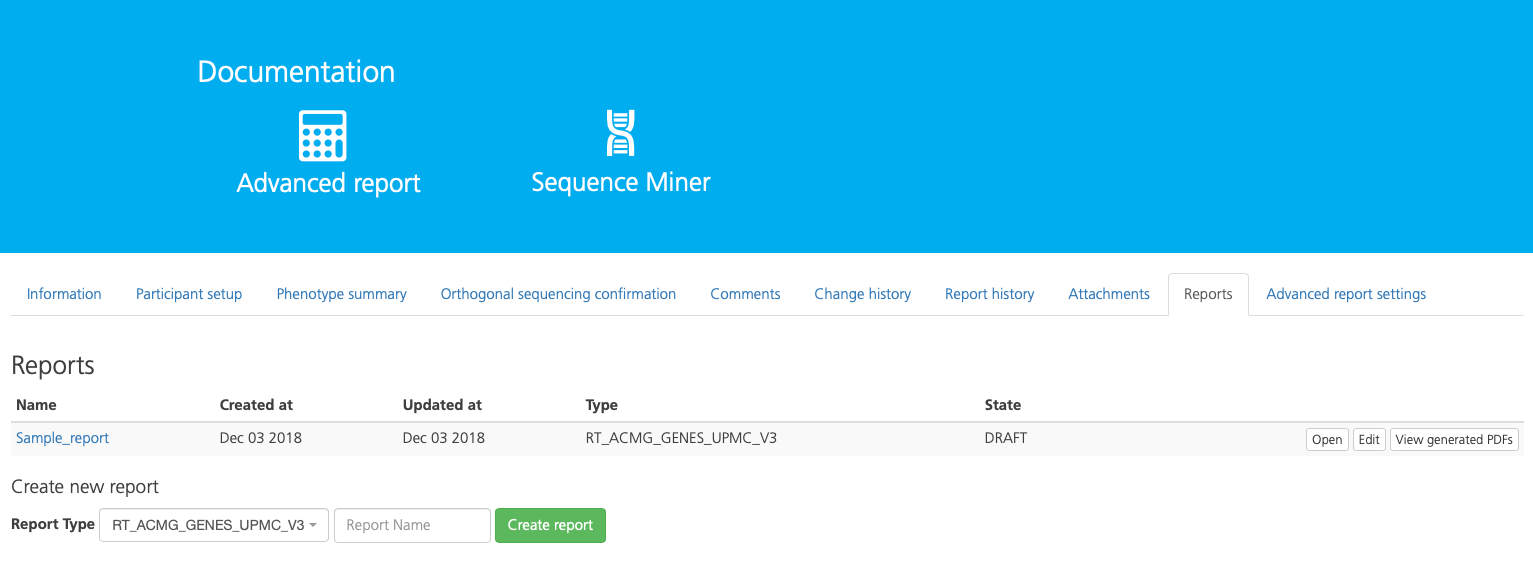
Report details are displayed in the following columns:
Column |
Description |
|---|---|
Name |
The name of the report |
Created at |
The date the report was generated |
Updated at |
The date the report was updated |
Type |
The selected Report Type |
State |
The report state, e.g., Draft |
For more information about how to create a report, see Generating a Report.
Query settings
The Advanced report settings tab allows you to customize your analysis by designating candidate genes and setting analysis parameters. Design and apply a custom candidate gene list to filter for genes relevant to the phenotypes of study participants. If the selected study is of the Mendel study type (recommended, see also Creating a new study), additional analysis filters contain default settings which can be accepted or modified. Advanced reports also enable filtering by mode of inheritance for familial analysis.
advancedReportSettings are organized in subtabs which can be expanded to view and edit. Default settings for each filter are shown in brackets ([]). Findings are organized in tabs on the Advanced report page of the selected study.
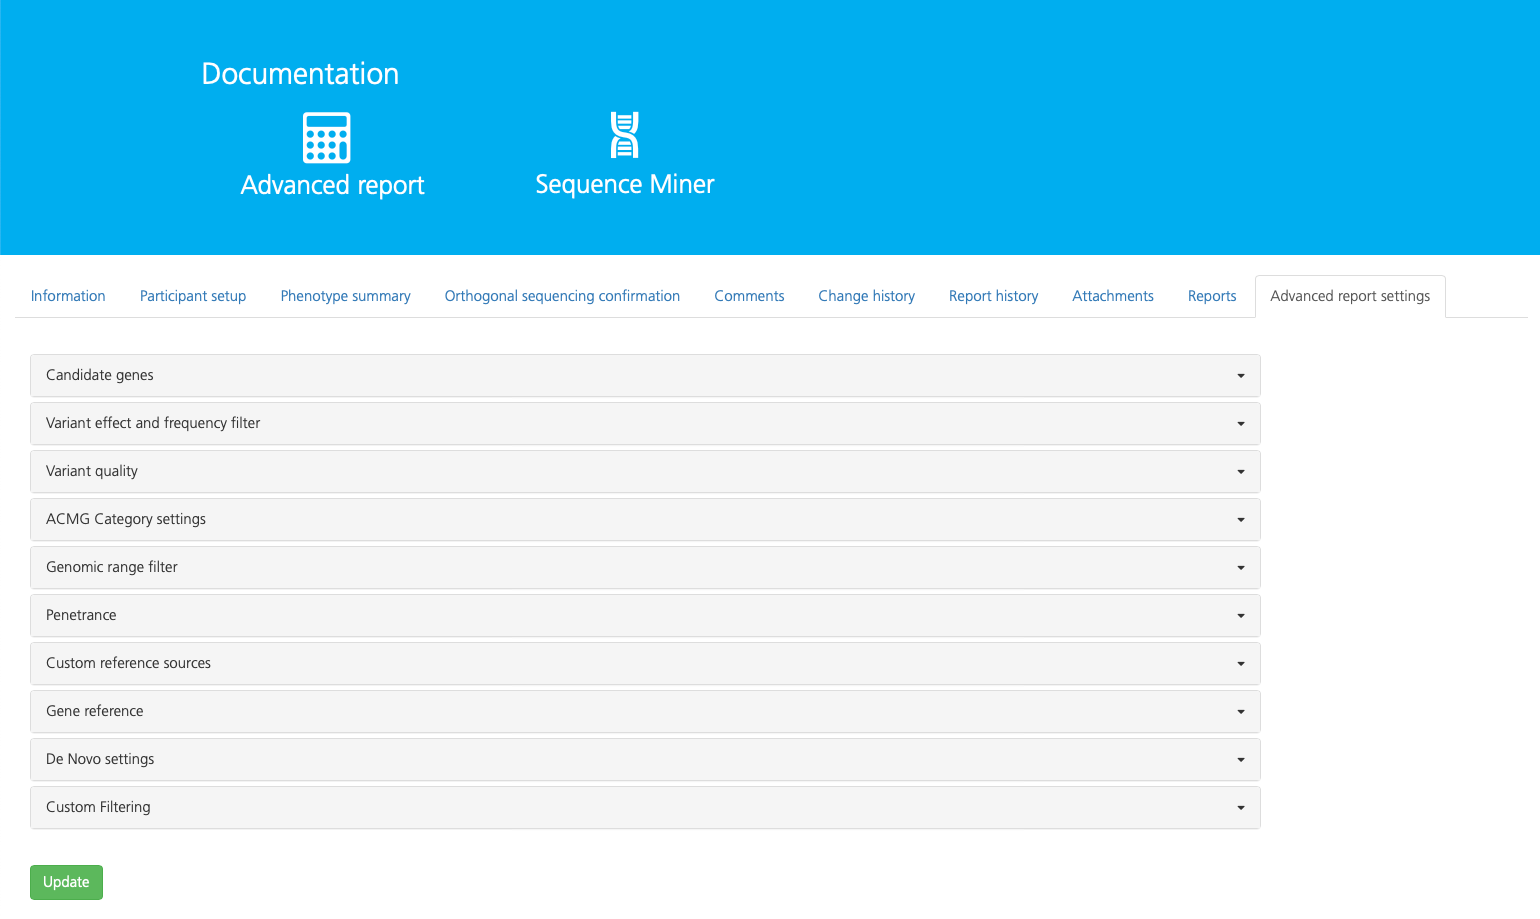
The following table provides a brief overview of report settings subtabs:
Subtab |
Description |
|---|---|
Filter variant analysis to include phenotype-associated gene sets, paralogs, defined gene lists, and/or custom gene lists |
|
Filter variants by population allele frequencies and biological consequence |
|
Filter variants by sequence read depth and quality scores |
|
Filter variants by clinical impact as designated by the American College of Medical Genetics and Genomics (ACMG) |
|
Filter exonic and repeat regions of the genome to include/exclude for variant analysis |
|
For studies with larger families, filter variants by the percent occurrence in the affected (‘case’) and unaffected individuals (‘controls’) groups |
|
Select custom filters for allele frequencies, genomic regions, and gene panels by importing user-specified reference lists for analysis |
|
Filter to include/exclude UTR regions of the transcript in variant analysis and select the reference transcript database |
|
Define filter settings for calling de novo variants |
|
Choose whether to enable custom filter settings, such as defining an expiration date for approved annotations |
For detailed descriptions and editing options for each subtab, see Viewing Query Settings.
Workflow settings
If you have the Lab Manager or System Admin user role, you can access the Workflow settings tab to select the Workflow state for the study, depending on which stage of the workflow has been completed (according to the study workflow defined in the study type of the selected study).
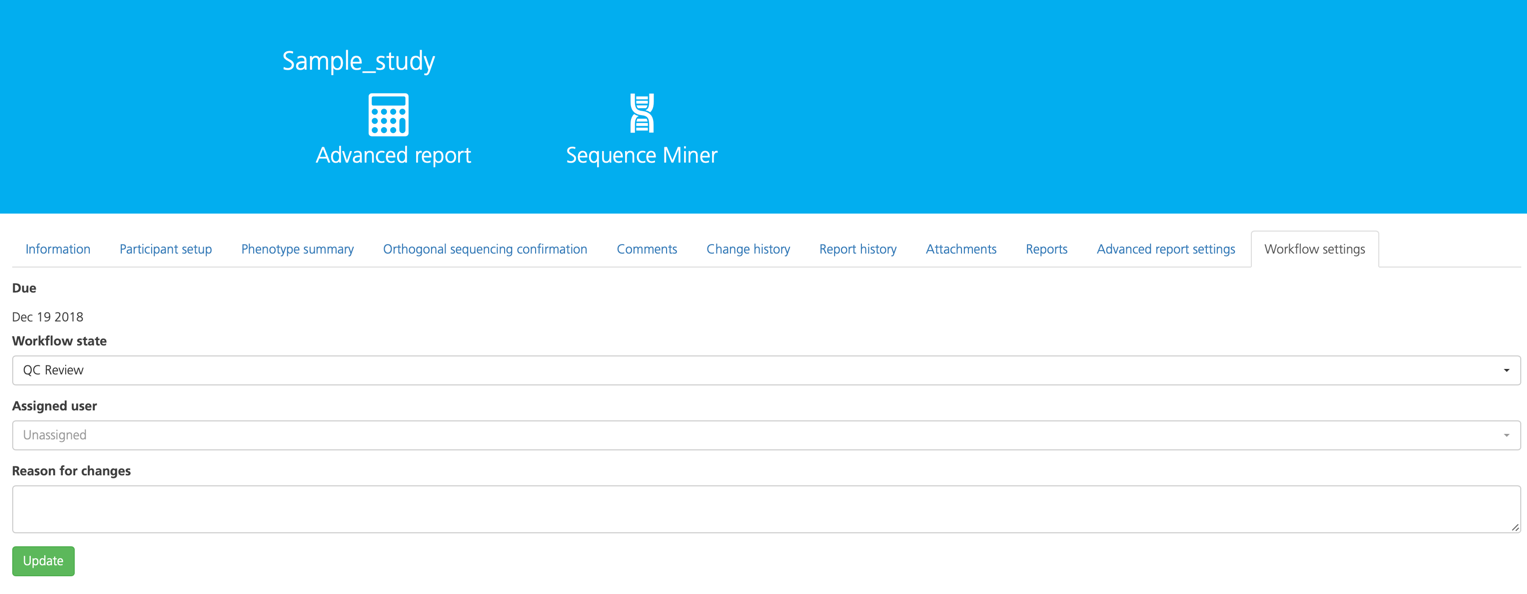

The study can also be assigned to yourself or another user from this tab (see also Assigning a study).