Samples
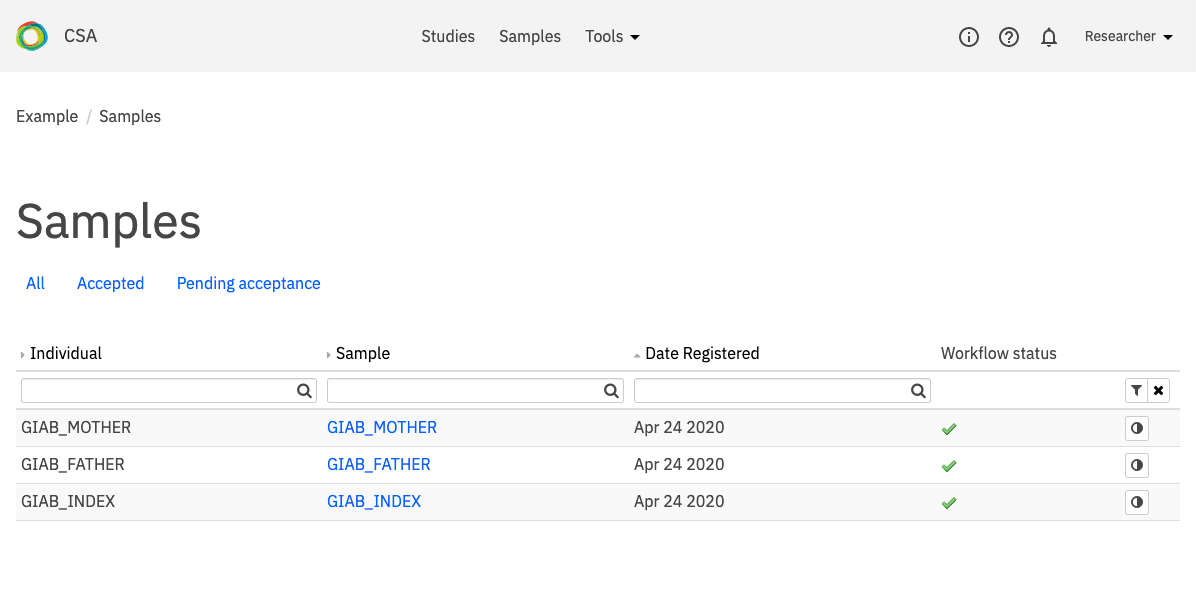
The Samples page displays all participants in a project. From this page, you can view and edit information about each sample. Sample import is done through the CSA administration pages and cannot be performed from here.
Samples overview
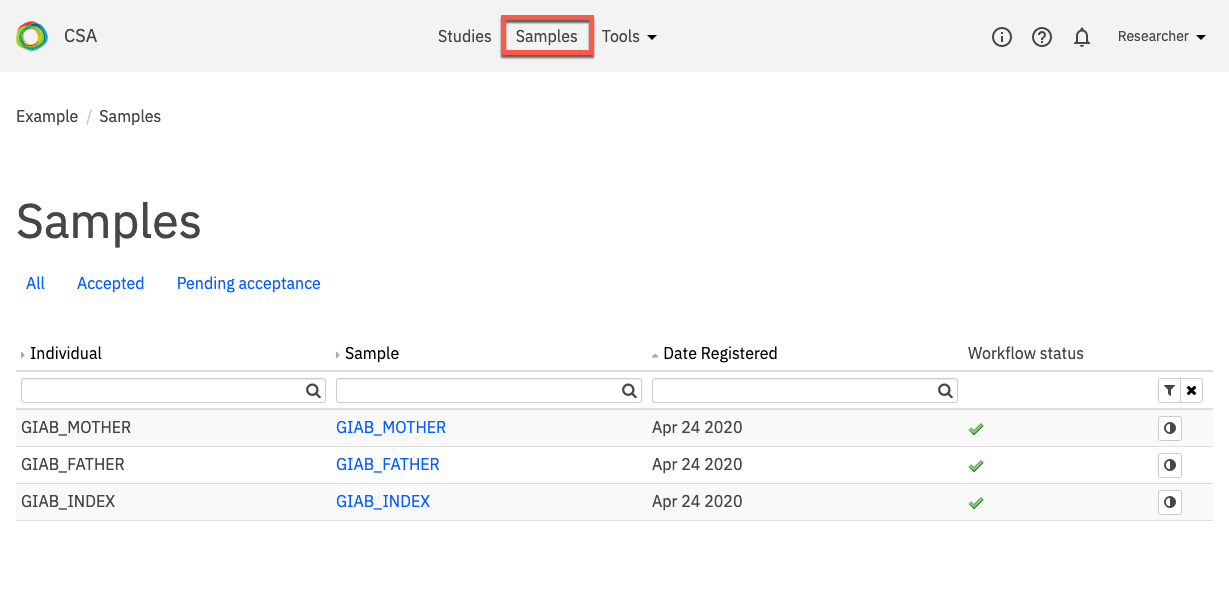
To access the Samples page, click the Samples link in the top navigation.
Participant information is organized in columns, described in the table below:
Column |
Description |
|---|---|
Individual |
The individual ID for the selected participant; can be the same as the Sample ID, but for some users it may be more useful to have two identifiers; this ID does not appear in Sequence Miner Subject Reports or as the PN throughout the system |
Sample |
The sample ID assigned to the selected participant’s sample; because it is the ID assigned to the data (BAM and VCF files) this ID appears in Sequence Miner Subject Reports and as the PN throughout the system |
Date registered |
The date the sample was accepted into the project |
Workflow status |
The status of the sample: a cog icon indicates that the data for the sample is being processed; a check mark icon indicates that the data has been processed and is ready to be assigned to a study |
Phenotypes |
The Phenotypes icon (half-moon) indicates whether phenotypes have been entered for the selected sample - if phenotypes have been entered, the icon turns green; clicking the icon opens the Registered phenotypes page, where phenotypes can be viewed or edited for the selected sample (see also Participant setup). |
Filtering samples
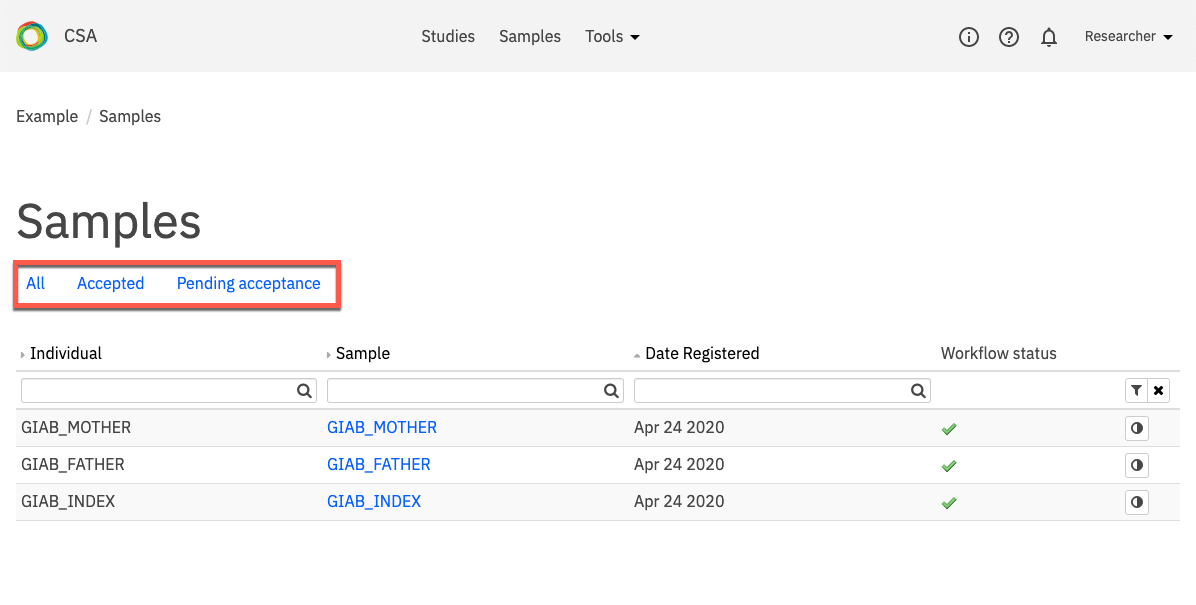
Samples can be filtered to see All samples, Accepted samples only, or samples that are Pending acceptance by clicking the links at the top of the page.
Viewing sample details
To see details about a selected sample, click the Sample ID to open the Sample page.

The Sample page contains six tabs that provide information about the selected sample:
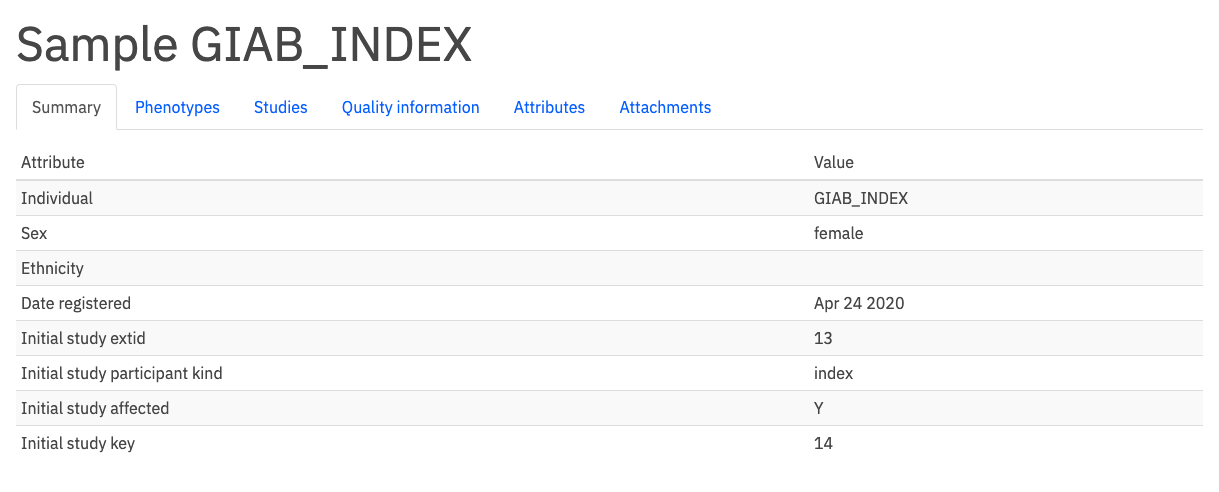
Summary - Displays the Individual ID, Sex (gender or biological sex), Ethnicity, Date registered, and Update information assigned to the selected sample.
Phenotypes - Displays the clinical symptoms entered for the selected participant through the Phenotips tool, including the Taxonomy (HPO or OMIM), Code, and Name of the class description. The Present column displays a “Y” or “N” (Yes or No) to indicate whether the selected participant exhibits the symptom.
Studies - Lists all the studies to which the selected participant has been assigned in the project, including the Study name, Participation role of the participant in the selected study (e.g., “Mother”, “Sibling”, etc.), and whether the participant is an Affected individual in that study. Clicking on a Study name in the list opens the Study Overview page for the selected study.
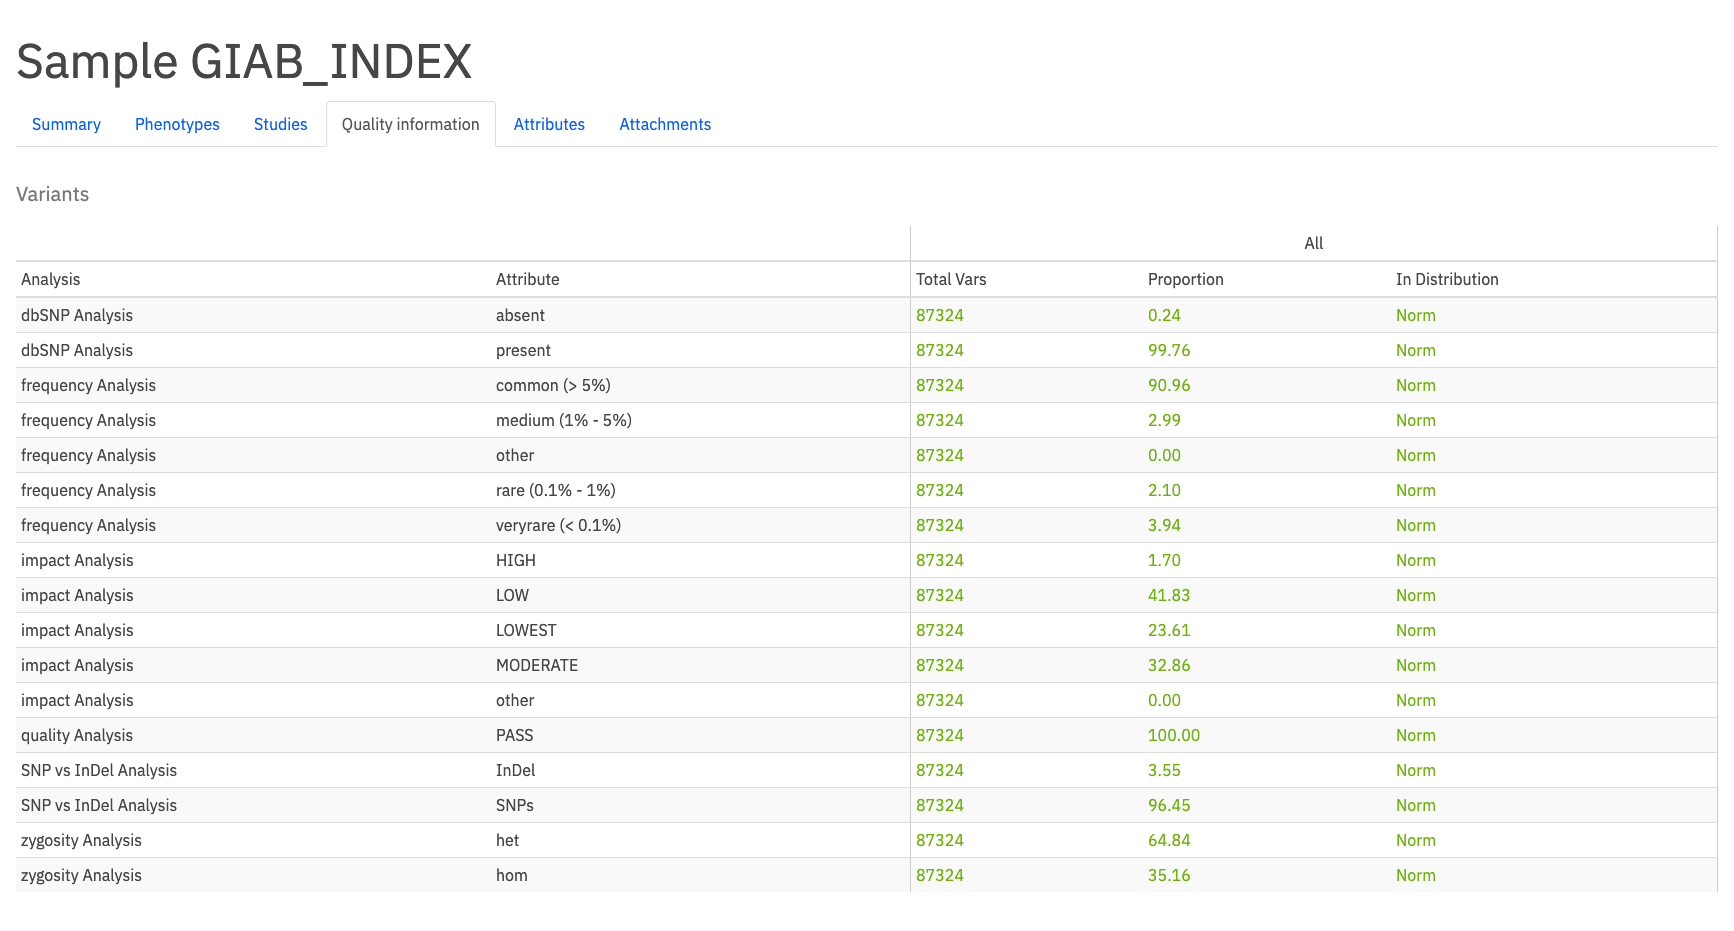
Quality information - Provides measurements and statistics to determine the quality of the sample data for the selected participant. Metrics are described for Variants, QC Ratios, Exome, and Genes. Quality scores are calculated for the indicated Analysis and Attribute. Quality measures are compared to those of other samples in the same project and are reported in the In Distribution column as “Norm” if they are within two standard deviations of the mean. “Low” indicates below two standard deviations of the mean, and “High” indicates above two standard deviations of the mean.
Attributes - Contains attributes included during the sample upload, on both the sample and individual level. These can include any associated metadata fields (e.g. sample lab) or additional information (e.g. date of birth). This tab also typically includes information about sample processing during upload to the system, such as pipeline steps performed for the selected sample.
Attachments - Provides access to additional documents associated with the sample.
To close the Sample page and return to the dashboard, use the links in the navigation bar at the top of the page.


